You have an awesome Reflexology Service, but do you want to know why you’re not reaching as many people as you deserved? The problem is not your business, it’s the people you want your service to cater to. Now, how can a custom infographic help your Reflexology Service?
There was a recent study that found most people in the UK don’t even know what Reflexology is. According to statistics, where the respondents are British adults 18 years and older when they were asked if they think Reflexology is effective at treating illnesses, 23% of these individuals don’t know what Reflexology is!
And out of these people, 41% think it’s possibly an effective treatment, while 19% say it’s probably NOT effective. These 19% and 23% are most likely to avail of your reflexology service if they know what it is and how it will benefit them.
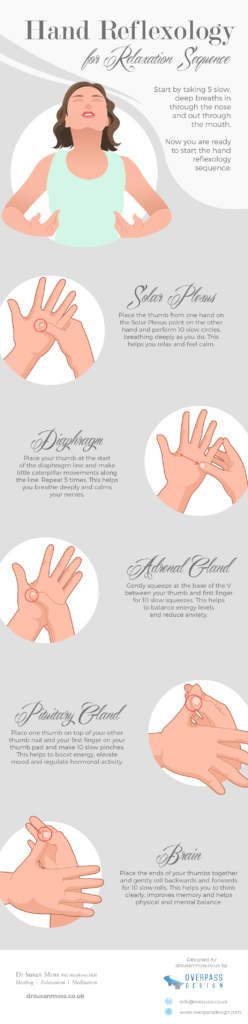
Reflexology is a therapeutic method of relieving pain by stimulating predefined pressure points on the feet and hands. This controlled pressure alleviates the source of the discomfort. In the absence of any particular malady or abnormality, reflexology may be as effective for promoting good health and for preventing illness as it may be for relieving symptoms of stress, injury, and illness. Some benefits are, and not limited to:
- Gives relief from Stress, Anxiety, and Insomnia.
- Stimulates blood circulation in the body.
- Beneficial for stimulating the nervous system.
- It helps to improve the metabolism and the energy creation process in the body.
- Aids in the elimination of toxins from the body, thus, improve cognitive health.
Does your target market know that too? In order to educate people, you need good design to convey these data more effectively. And this is where infographics come in.
8 out of 10 people retain data and information based on what they see. Visually appealing data representation is the perfect way to achieve this. Some examples of these are explainer videos and infographics. Infographics are “liked” and shared on social media 3X more than other any other type of content. (source)
This kind of content will not only pique your customers’ interest, but it will make them retain the information better. So, they are more likely to act upon those pieces and bits of information. And that’s because visuals add a component to facts and figures that text cannot: speed.
Moreover, social media reach performs better with good design and representations when compared to content using stock and static images. When people hear information, they’re likely to remember only 10% of that information three days later. However, if a relevant image is paired with that same information, people retained 65% of the information three days later. (source) Eye-tracking studies show internet readers pay close attention to information-carrying images. In fact, when the images are relevant, readers spend more time looking at the images rather than they do reading text on the page. (source)
What I want to impart here is that infographic is a very powerful tool for information dissemination. Public awareness together with great social media management, plus a powerful content marketing strategy will be able to help your Reflexology service known to your target market.
(P.S. If you’re interested in making your blog contents turn into infographics, you can contact us at [email protected] and please visit our Overpass Design website: http://www.overpassdesign.co.uk to check out the latest designs and infographics created by our designer.)
Loved this article? Please like and share!
If you have insights or comments about the article, please leave a comment below. Please don’t forget to follow us on Twitter @OverpassApps and Instagram @overpassapps and like us on Facebook.